This article is for members only. You can see all by registering as a member (free of charge).
Serial table of contents
Target: Excel 2016/2019/365
How to read more than 1 million rows of data in Excel? Excel can only read 1,048,576 rows of data. CSV files with more lines can be read by preprocessing with Power Query.With the spread of the Internet and IoT, it has become easier to collect a lot of data these days. You may want to easily analyze such data with "Microsoft Excel".
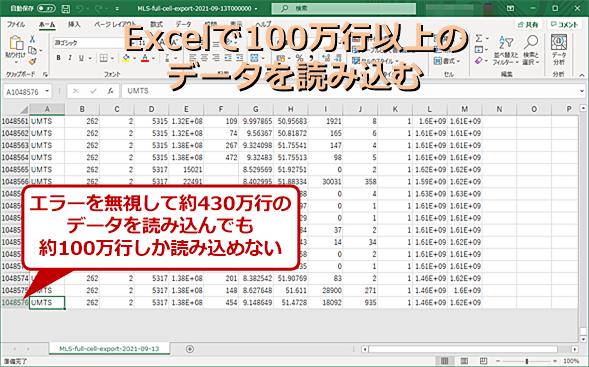
However, in Excel, the maximum number of rows that can be handled is only 1 million rows (to be exact, 1,048,576 rows). Data with more rows than this cannot be handled directly by Excel. However, it is not impossible for Excel to process a text file with more lines than the Excel limit if the conditions are met.
The confirmation was done with Microsoft 365 version of Excel and Excel 2016, but the screen etc. are using Microsoft 365 version. The basic operation is the same, although there are differences in some parts of the ribbon.
Process large amounts of data in Excel
When processing a large amount of data, there are two main types of processing possible. The first is "filtering," which retrieves only data that meets certain conditions. Regardless of the number of rows of the original data, if the result of filtering is 1 million rows or less, it will be possible to read this in Excel. If it can be read into Excel once, the subsequent processing is the same as normal data processing.
The other is to aggregate the data. Even if there is a large amount of data, in the aggregation process that calculates the total value or the average value, multiple rows can be combined into one of the aggregation rows, so it can be processed in Excel.
For example, even the test result data of 10 million students (at least 10 million lines) can be aggregated into one line if the average value of the test is calculated. If there are multiple tests and the data is in list format, the total number of rows is the number of tests x the number of students, but if the number of test types does not exceed 1 million, it is possible to read the aggregated results into Excel. If it is read, normal Excel processing is possible, so processing such as graphing and formatting tables becomes possible.
Here, the explanation is based on the assumption that "filtering" and "aggregation" processing is performed on data exceeding 1 million rows. There are various data and various processing methods in the world, but in many cases either of these two can be applied. On the contrary, if either of these processes can be applied first, even the largest data can be processed in Excel.
However, in Excel, the file formats that can be used in such cases are limited, and only text-based file formats such as CSV and tab delimited are targeted. However, since most of these large volumes of data are text-based, there seems to be no practical problem.
Here, the explanation is based on the assumption of an easy-to-understand CSV format file. As sample data, use the mobile phone base station information file (CSV format) published by Mozilla Location Service. I only selected it on the condition that it is available from the Internet and has more than 1 million lines, and I will not explain the content or meaning of this data. However, knowledge of the data, such as which rows should be filtered and what should be aggregated, is essential when performing the operations described below for your own data. In other words, processing is difficult without understanding the meaning of the data.
For the data, the data for September 13, 2021 was obtained from the above URL (file name is "MLS-full-cell-export-2021-09-13T000000.csv"). Since the data is updated daily, please understand that there will be differences in the aggregated values of the samples. Also, this file was about 341MB and had 4,295,283 lines.
Download data from Mozilla location service Open the "Mozilla location service Download" page in your web browser and click the link in the "Full Cell Exports" column to download the data. Since it is archived in gzip format (extension .gz), decompress it with 7-Zip etc. and extract the CSV file.This data is a collection of networks (almost synonymous with mobile phone operators, but some operators have multiple network numbers due to mergers, etc.), countries to which the operators belong, communication methods, coordinates, etc. for mobile phone base stations. I did. For reference, the structure of CSV data is explained on the "Data import and export" page.
Filter the data and load it in Excel
First, as an example of a filtering operation that retrieves only rows with a specific value from the data, in the "mcc" column (code assigned to the country representing the country of affiliation), the Japanese codes "440" and "441" Take out the data that has only "" and load it into Excel.
Start Excel and load the data with [From text or CSV] in the [Get and convert data] group on the [Data] tab of Excel (In Excel 2016, select [New query] on the [Data] tab. Click and select [From File]-[From CSV]). Please note that if you double-click the CSV file to start Excel, all the data cannot be read.
The [Import Data] dialog opens, so select the CSV file you want to read (in this example, select "MLS-full-cell-export-2021-09-13T00000.csv"). A preview of the first part is displayed. Up to this point, it is the same as reading a normal CSV or text file. For this, please refer to Tech TIPS "[Excel] CSV files for daily aggregation are also automatically updated with the query function".
Now press the [Convert Data] button at the bottom of the dialog. Press the button to launch the "Power Query Editor". The preview area should show the data loaded in an Excel-like format.
Here, as with the "filter" function of Excel, use the downward triangle (▼) in the heading to select the data to be displayed in the column with the conditions you want to retrieve. At the first stage, all the data has not been read, so the checklist of values is only partially displayed. Therefore, you need to click the [Read more ...] link below to load the data, find the item you need, and select the check box "On".
Next, if you uncheck the "(Select all columns)" checkbox and then enter "44" in the search box above, only those that contain "44" as part of the value will be displayed. Look for "440" and "441" from here, set these two check boxes to "On", and click the [OK] button.

Finally, if you press the [Close and Load] button, a new worksheet will be created and the result of filtering as a table will be loaded into it. In the sample data, there were 317,512 rows (excluding the heading row) of data having "440" or "441" in the "mcc" column.
Filter the data and load it in Excel (1) Select [Get and Convert Data]-[From Text or CSV] on the [Data] tab. ▼ Filter the data and load it in Excel (2) The [Load Data] dialog opens. Select the CSV file and click the [Import] button. ▼ Filter the data and load it in Excel (3) When the preview is displayed, click the [Convert Data] button. ▼ Filter the data and load it in Excel (4) The data loaded in the Power Query editor opens. ▼ Filter the data and load it in Excel (5) Click [▼] in the heading of the "mcc" column, and click the [Read more ...] link below. ▼ Filter the data and read it in Excel (6) Uncheck [Select All] and enter "44" in the search box. After checking "440" and "441", click the [OK] button. ▼ Filter the data and read it in Excel (7) The value of "mcc" is filtered and only the rows of "440" and "441" are displayed. Click the [Close and Load] button on the [File] tab. ▼ Filter the data and read it in Excel (8) As a result of filtering, the data becomes about 320,000 lines and can be processed in Excel.Even if the data exceeds 1 million rows in this way, the data read into the worksheet can be limited to 1 million rows or less by filtering by specifying the conditions. In this state, it's a normal Excel table, so you can do all the normal operations such as adding columns and sorting.
Conversely, if you can add filtering conditions to the data so that the number of rows is 1 million or less, you will be able to process any data in Excel.
You can also change the filtering criteria to load another table with other criteria into Excel in the same way. By doing this, even if the data exceeds 1 million rows, it can be divided and read into Excel.
Aggregate the data and read it in Excel
If the data is divided and read, it will be difficult to aggregate the data as a whole. On the other hand, if you need to aggregate the whole, you can reduce the number of rows by using Power Query first.
Now, let's aggregate the same data. Load the CSV file by selecting [Get and Convert Data]-[From Text or CSV] on the [Data] tab, and when the preview is displayed, click the [Convert Data] button to load the CSV file into the "Powe Query Editor". .. As an example, aggregation is performed by communication method (“Radio” column) for each network (“net” column) for each country (“mcc” column).
Copyright © Digital Advantage Corp. All Rights Reserved.


![Advantages of "Gravio" that can implement face / person recognition AI with no code [Archive distribution now]](https://website-google-hk.oss-cn-hongkong.aliyuncs.com/drawing/article_results_6/2022/2/25/98ceaf1a66144152b81298720929e8e7.jpeg)